My experience building a digital dashboard for the Seattle Fire Department
Command Central was designed as part of the UX hackathon, organized by DubsTech club at University of Washington.
This saw participation from 650+ global participants and an esteemed panel of 25 judges. Out of the 78 teams in the "Enterprise" track, this project bagged the 2nd runner-up.
MY ROLE
Lead UX Designer
Design prompt
We have to help the Seattle fire department go digital
Design a platform that allows the Seattle Fire Department to:
1. Discover an incident, allocate resources to it, and then create a report on it after
2. Leverage data to analyze historical incident data, identify trends, and generate insightful reports to inform decision-making and resource planning
Snapshot of the solution
A centralized incident tracking system and analytics dashboard for Fire Alarm Center
Enables the rescue operation coordinator to consume information and manage resources quickly and efficiently.
Allow for customised analysis of historical data using AI and generate insights that will help in strategic long term planning and resource allocation.
The final result
We created an interactive prototype to showcase how the platform would function
What did the discovery phase include?
We conducted extensive secondary research to understand how fire departments operate and analysed the existing systems that are in place.
To truly grasp how fire departments operate, we dove into research, watching videos, reading articles, exploring fire department websites, and even reaching out to experts.
We discovered that firefighters use the National Fire Incident Reporting System (NFIRS) to log emergency incidents. They rely on tools like Geographic Information Systems (GIS) and mobile data terminals to track locations and communicate in real time.
But, NFIRS isn’t perfect. It's tricky to use, requires a lot of training, and has inconsistent data entry. Plus, it doesn’t integrate well with other tools and lacks real-time insights, making it challenging for fire teams to get the best results.
What did we identify from our reserach?
We identified and highlighted some key information required to build the dashboard.
The key stakeholder: Internal stakeholders include fire department members, officials, and related emergency agencies, while external stakeholders are the public and businesses within the department's service area.
The number of emergency calls they respond to: The Seattle fire department responds to 120+ emergencies using specific codes.
The resources dispatched during emergencies: The Resource Management Division includes the Fire Alarm Center, Services, Training and Safety.
Some key metrics tracked by the fire department: They track metrics such as the number of calls, fire loss, number of incidents, calls responded, fire types, etc.
What did the ideation process look like?
We set some guidelines before we started the design process and divide the work in 3 steps.
STEP 1: Decided to design a web portal
We chose to create a web portal to streamline access to numerous information points. This allows the administrator to quickly navigate between different sections and efficiently consume the information they need.
STEP 2: Created a user flow / low-fi sketches
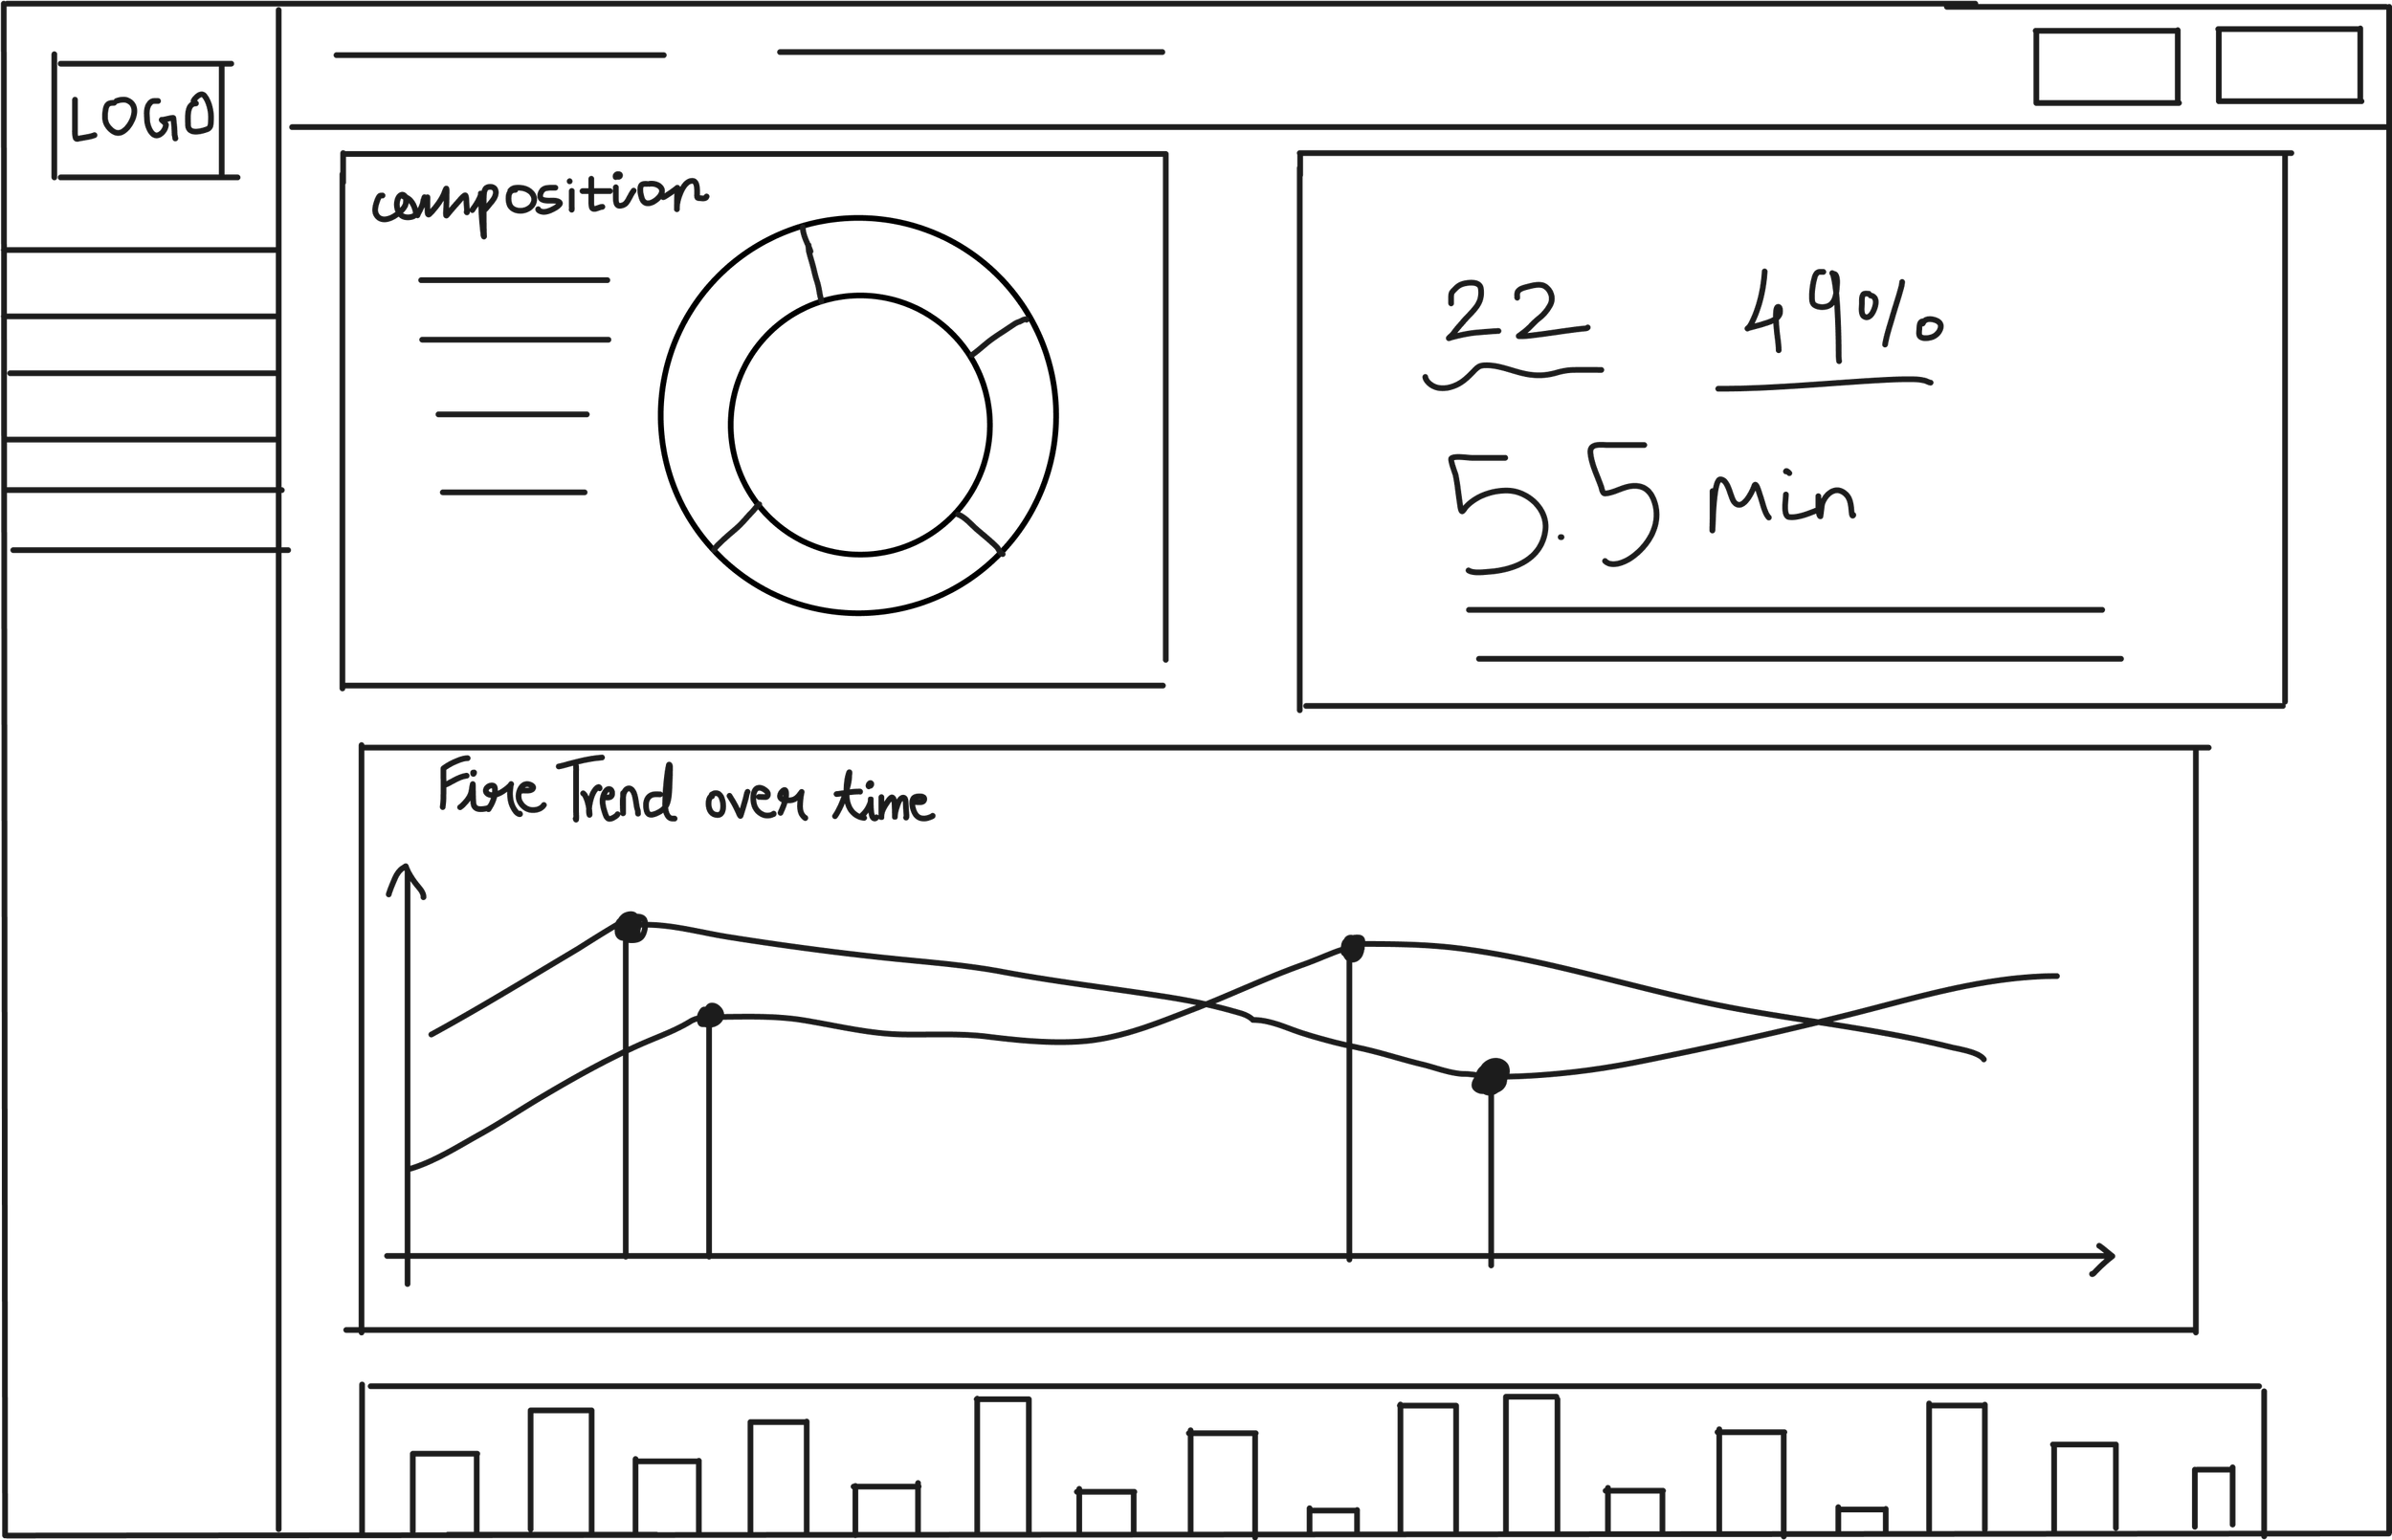
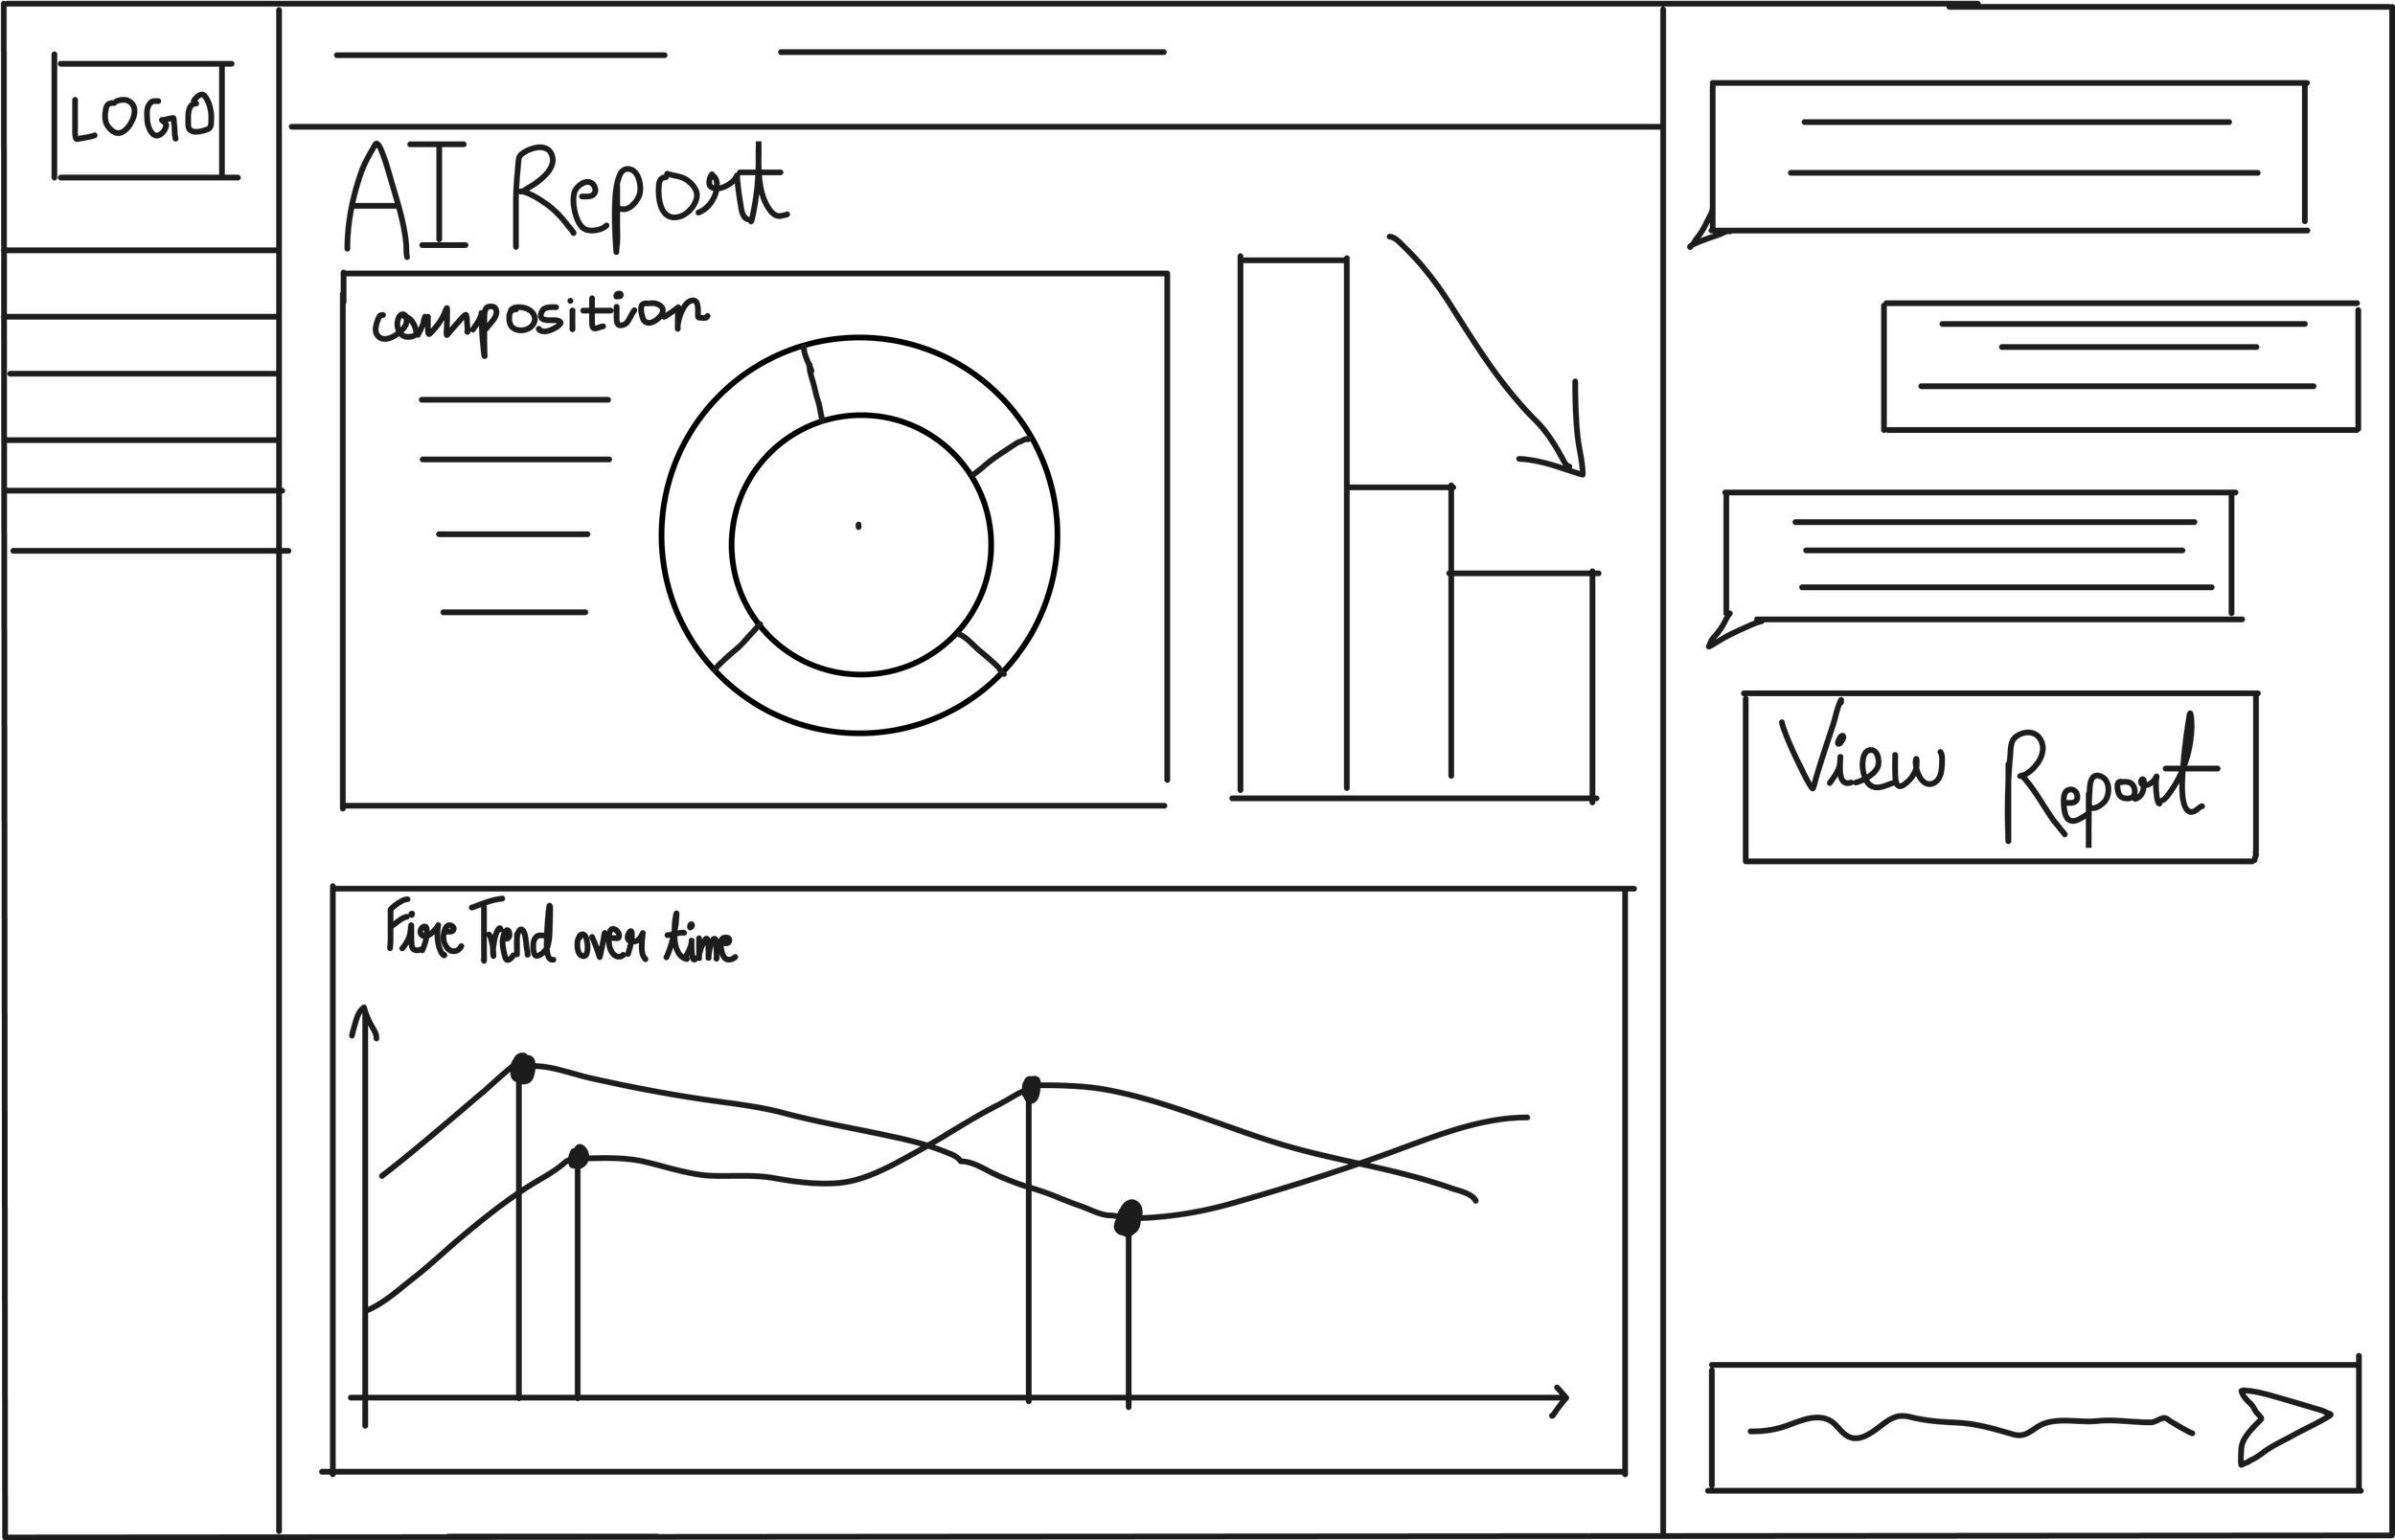
We sketched out some low fi-wireframes that helped us identify key elements in each of the flows that would support jobs-to-be-done.
A ticket based incident tracking dashboard
Interactive data Analytics dashboard
Real-time resource Allocation and status tracking
AI-Assitant & Reporting Tool
STEP 3: Divide the tasks
Once we were clear what we are designing, we divided up the work. I picked up the AI reporting and the data dashboard.
What did the design process look like?
We made sure we used accessible colours, designed reusable components to save time and made a interactive prototype of the AI-Assistant JUMPER.
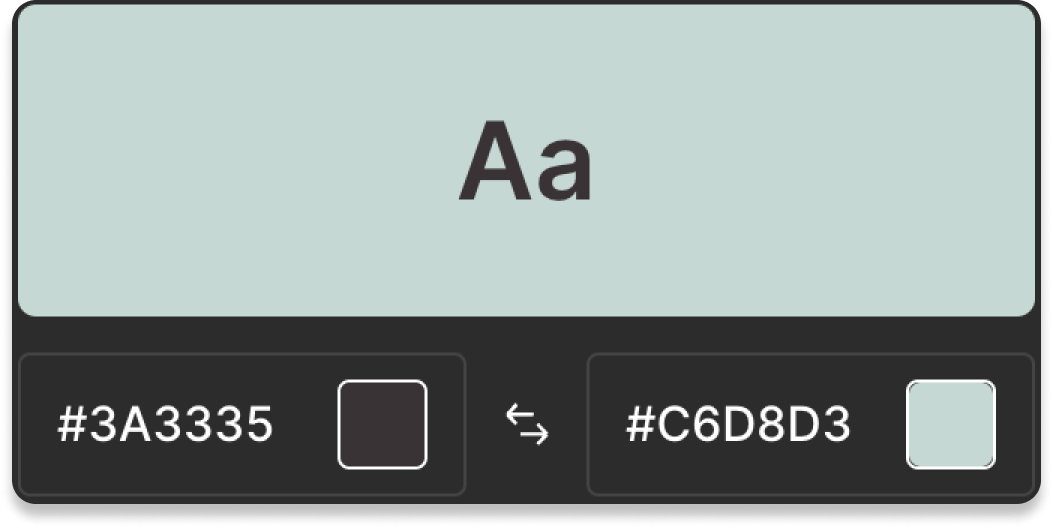
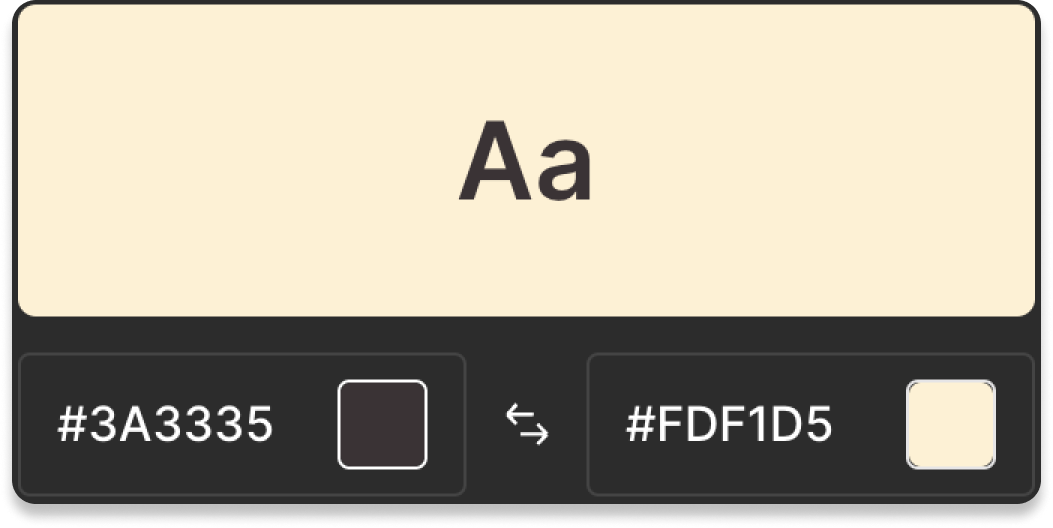
Accessible colour palette: We made sure the selected colors are color-blind friendly for category classification and meet AA contrast requirements according to WCAG 2.2.
Designing reusable components: Created variants for the dashboard cards so that its easy to replicate the UI. We also created variants for the navigation and ai-assistant so that they are interactive, clickable and intuitive.
Variants for the primary navigation and AI-assistant chat box.
Take a look at the final designs
Hi-fidelity Mockups
Data Analytics Dashboard: The user can view key metrics, geographic distribution, and trend over time in a customized time frame. The dashboard highlights, AI-generated insights and recommendations to help in long term resource planning.
Bird-Eye View For Emergency Management: The combination of list and map view gives crucial information about incident details and real time location on the map. Incident details, status updates, resource management, and leveraging AI for report generation all at one place.
AI-Assitant & Reporting Tool - JUMPER: Using AI to analyze historical data, identify trends, and generate insightful reports to inform decision-making and resource planning. The administrator can further access reports generated by AI in the repository.
Retrospective
So what did we learn and what challenges did we face?
This project simplifies the complexities of fire department operations, but there's much more to it than we could capture in a 24-hour hackathon.
Fire departments follow intricate protocols, coordinate with other agencies, and handle a range of incidents—from false alarms to massive wildfires. Their duties extend beyond fire emergencies to include responses to vehicle accidents, medical emergencies, and more.
My biggest learning…
“This was my first hackathon, and to say I was nervous would be an understatement. I was surrounded by university students and professionals with far more experience than me, and to top it off, I couldn’t find a teammate until the last hour. I almost gave up...
In the end, we were just a two-person team competing against groups of four or five, which felt daunting. But I pushed myself completely out of my comfort zone. With only three hours of sleep, I used every ounce of creativity and adaptability I had. It was challenging, humbling, and incredibly rewarding—an experience I’ll never forget.”


